
Crypto Data Online Explore Blockchain with Easy Resources
Traditional financial records are locked behind vault doors and private servers. If you want to see the ledger of a major global bank, you are out of luck—that data is proprietary, heavily guarded, and hidden from public view.
Public blockchains completely turn this model upside down. A blockchain is a globally shared, decentralized database that records information in a way that makes it viewable by anyone, anywhere, at any time. Every single transaction, piece of code deployment, and wallet balance is broadcast to a completely open network Crypto Data Online.
Stepping into the world of blockchain data doesn’t require an advanced degree in computer science or a background in high-frequency trading. It simply requires knowing where to look and how to use the free, highly accessible tools available online. This comprehensive guide will walk you through the easiest, most powerful resources to explore real-time blockchain data without spending a dime.

1. Network Explorers: The Search Engines of Blockchain
The absolute easiest way to view the blockchain is through a Block Explorer. Think of a block explorer as a search engine—like Google, but specifically built for indexable ledger data. Every primary blockchain network has its own dedicated explorer. The most widely used platforms include Etherscan (for Ethereum), Solscan (for Solana), and BscScan (for BNB Chain).
When you look at a block explorer, you are looking at raw, live history being written in real-time. You can paste any public wallet address, transaction ID, or smart contract address into the search bar to see its history instantly.
Core Metrics to Observe
- Transaction Hash (TxHash): A unique alphanumeric string that acts as a digital receipt for a specific transaction.
- Block Height: The sequential number of the block currently being added to the chain. Think of it as a page number in a never-ending ledger book.
- Gas/Transaction Fees: The amount of network currency paid to the validators or miners to process your request. When the network is busy, these fees rise.
How to Audit a Transaction Live
To easily verify a transfer on a public block explorer, apply these foundational steps:
1.Secure the Identifier:Locate the alpha-numeric TxHash string.
Copy the 64-character transaction hash or public wallet address from your source application or log.
2.Execute an Explorer Search:Use Etherscan, Solscan, or similar web tools.
Navigate to the blockchain’s official explorer web page and paste the copied string directly into the main search bar.
3.Confirm Transaction Finality:Look for the green Success label.
Check the Status or Result section to ensure it reads Success or Confirmed, proving the block has been permanent written.
4.Examine Addresses and Fees:Trace asset source and ultimate destination.
Identify the From and To directions to verify the asset moved along the correct path, and review the final network fee charged.
2. Macro Data Platforms: Zooming Out on Market Health
While block explorers are great for looking at micro details (like single transactions), Macro Aggregators help you look at the entire landscape at once. If you want to know which ecosystems are growing, how much value they hold, or how active their communities are, these are your best free resources.
Ecosystem Aggregation via DefiLlama
DefiLlama is one of the most respected data tools in the Web3 space because it is entirely free, open-source, and does not display distracting advertisements. It acts as a massive dashboard tracking the health of Decentralized Finance (DeFi).
- Total Value Locked (TVL): This is the core health metric of an ecosystem. It measures the aggregate value of all crypto assets deposited directly into a blockchain’s applications. A climbing TVL indicates strong developer activity and user trust.
- Chain Rankings: DefiLlama allows you to instantly compare different blockchains side-by-side to see which ones are attracting the most capital over 7-day or 30-day windows.
Supply and Price Trackers: CoinGecko and CoinMarketCap
To understand the financial scale of a project, beginners often look solely at token price. However, data analysts rely on Market Capitalization to determine an asset’s true size. Tools like CoinGecko gather this cross-market data using a simple, fundamental formula:
$$\text{Market Capitalization} = \text{Current Token Price} \times \text{Circulating Supply}$$
When exploring these sites, always check the Fully Diluted Valuation (FDV). The FDV calculates what the market cap would be if all future tokens were unlocked and circulating today. If a token has a low current market cap but a massive FDV, it means a flood of new supply will be released over time, which can fundamentally dilute the value of existing tokens.
3. Visual Analytics: Transforming Numbers into Pictures
Raw cryptographic data consists of long strings of letters and numbers that can quickly cause visual fatigue. Advanced, free visualization tools solve this problem by turning abstract spreadsheets into interactive, human-readable maps.
       [ RAW LEDGER DATA ]               [ VISUAL ANALYTICS ENGINE ]
   0x71C...89A sent 50 ETH to 0x4E2      ○ Larger Bubble = Higher Asset Supply
   0x4E2...11B sent 45 ETH to 0x981 ───► ○ Linked Lines  = High Flow Volume
   0x981...55C sent 40 ETH to 0x71C      ○ Shared Color  = Clustered Wallets
Entity Tagging via Arkham Intelligence
By default, blockchains use pseudonymous addresses like 0x71C...89A. Arkham Intelligence provides a free platform that applies an artificial intelligence layer to label these anonymous strings. It tags addresses with their real-world identities, revealing which wallets belong to major institutions, exchanges, or public figures.
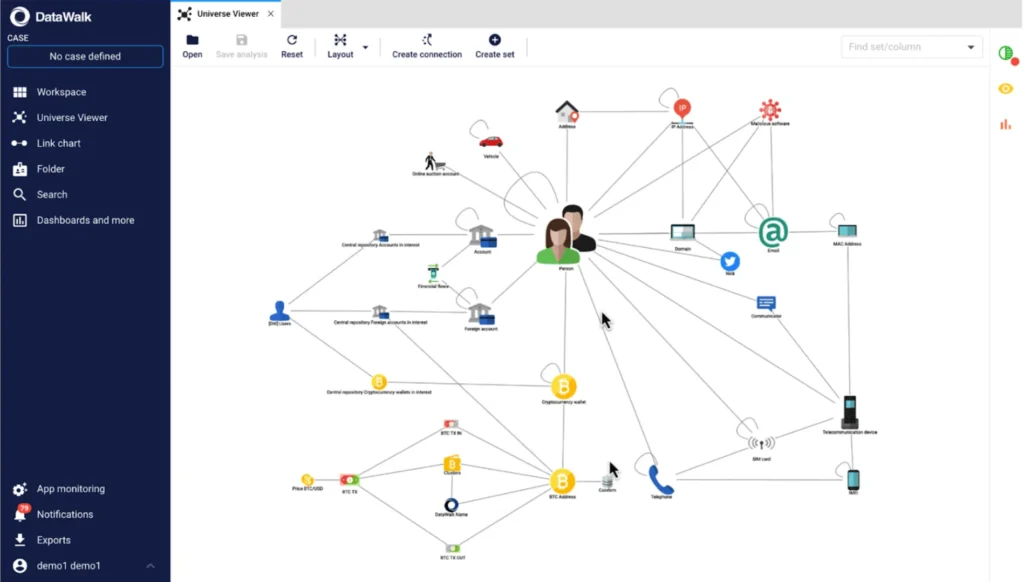
Its Visualizer tool allows you to input an address and watch it transform into an interactive spiderweb diagram. You can see lines connecting different entities, making it incredibly simple to visually track exactly where funds flow during large market movements.
Cluster Mapping with Bubblemaps
If you want to know if a project is truly decentralized or secretly controlled by a handful of insiders, Bubblemaps is the ultimate resource.
Crypto Data Online represents token holders as colorful bubbles; the larger the bubble, the more supply that specific wallet holds. If multiple wallets are constantly transferring tokens back and forth behind the scenes, the tool draws a physical link between them, visually exposing “wallet clusters.” This enables even absolute beginners to see if a small group of individuals secretly controls a dangerous percentage of a project’s total tokens.
4. Dune Analytics: Customizing Your Queries with SQL
For those who want to go beyond pre-made charts and build their own custom data pipelines, Dune Analytics is the premier platform. Dune constantly ingests raw, messy transaction data from multiple blockchains, decodes it, and neatly organizes it into structured relational database tables.
The best part about Dune is its collaborative nature: every Crypto Data Online built on the free tier is entirely public. If you see a beautiful chart tracking an NFT collection or a decentralized exchange, you can simply click “View Query” to see the exact code used to create it. You can “fork” (clone) that code into your own workspace and edit the Crypto Data Online to track an entirely different asset.
A Simple Blockchain Database Query
Dune runs on SQL (Structured Query Language), an industry-standard database language. To show how approachable this is, look at this sample code designed to isolate the top 5 most expensive transactions on the Ethereum network over the last week:
SQL
SELECT
    block_number,
    block_time,
    hash AS tx_hash,
    gas_used * gas_price / 1e18 AS fee_in_eth
FROM
    ethereum.transactions
WHERE
    block_time >= NOW() - INTERVAL '7 days'
ORDER BY
    fee_in_eth DESC
LIMIT 5;
Even if you have never coded before, you can read the logic naturally: it selects specific pieces of data (block_number, time, and calculated fees) from the ethereum.transactions table, narrows it down to the last 7 days, sorts it from highest to lowest (DESC), and limits the final readout to just the top 5 results.
Free Educational Courses to Solidify Your Crypto Data Online
If you want structured learning paths alongside these tools, several prestigious institutions offer complete educational platforms absolutely free:
| Platform / Institution | Course Title | Best Crypto Data Online For | Focus Area |
| Princeton University (via Coursera) | Bitcoin and Cryptocurrency Technologies | Deep Conceptual Theory | Cryptography, consensus, and network security foundations. |
| University at Buffalo (via Coursera) | Blockchain Basics | Structured Beginners | Smart contract logic, transaction processing, and academic framing. |
| Dune University (via Dune.com) | Getting Started with Dune | Hands-On Analysts | Writing custom SQL queries to build interactive crypto dashboards. |
Three Golden Rules for On-Chain Crypto Data Online
- Verify, Don’t Trust: The defining philosophy of the blockchain space is “Don’t trust, verify.” If a project claims on social media that it has gained millions of active users, don’t take their word for it. Look up their contract address on Etherscan or DefiLlama and check the transaction counts yourself.
- Keep Your Real Identity Safe: You do not need to link a personal bank account, provide a government ID, or spend real money to learn blockchain data analytics. Avoid any exploratory data tool that asks for sensitive personal information or private keys.
- Utilize Free Developer Faucets: If you eventually want to practice sending transactions or deploying test smart contracts, never use real capital. Switch your web wallet to a developer playground environment like the Ethereum Sepolia Testnet. You can use free online “faucets” to get simulated, zero-value test tokens, Crypto Data Online you to generate live data logs at absolutely zero financial risk.
By leaning on these transparent resources, you can skip past speculative market noise and build powerful, data-driven technical skills directly from the source.
See more about
About The Author
